
Specifications


Table Of Contents
- Content
- Welcome!
- Warranty
- 1. Getting Started
- 2. Software Configuration
- 3. Data Capturing
- 3.1. Open Files
- 3.2. Replay of Files
- 3.3. Editing Video Sequences
- 3.4. Saving Files
- 3.4.1. Setting the Recording Frame Rate
- 3.4.2. Setting the Recording Modes
- 3.4.3. Temporary Recording File
- 3.4.4. Saving Radiometric Video Sequences or AVI Files
- 3.4.5. Saving Image Data as Radiometric Snapshot or Text File
- 3.4.6. Saving Text File of the Temperature / Time Diagram
- 3.4.7. Location and Filename Templates of Triggered Recordings
- 3.4.8. Display of Snapshots in a Separate Window
- 3.4.9. Saving Images or Screenshots to Clipboard
- 4. Data Processing
- 5. Visual Camera (TIM200 only)
- Linescanner Mode
- 7. Further Information
thermoIMAGER TIM 49
In the Position section the exact position of the measure area within the main window can be defined. If desired
the area can represent a Hot spot (spot or area with highest mean temperature in the image) or a Cold spot
(spot or area with lowest mean temperature in the image).
Using Center you will be moving the measure area into the middle of the main window, using Standard size
the rectangle will be set in a predefined size.
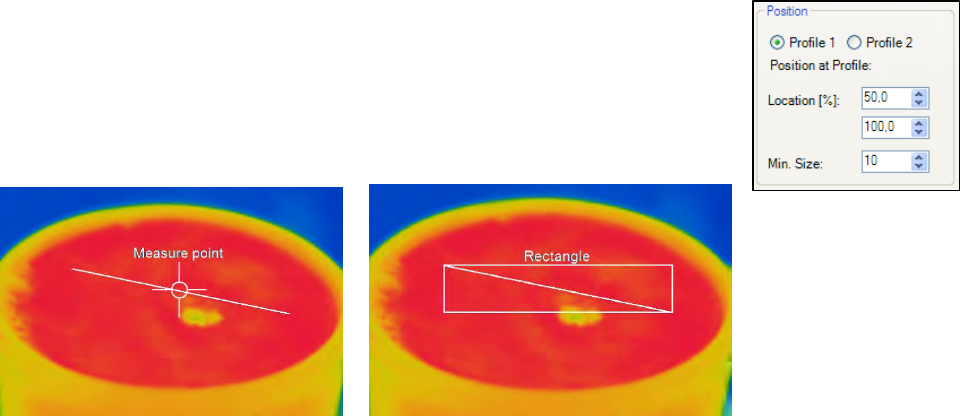
Using Bind to temperature profile you can assign each measure area to one of the
two temperature profile (Profile 1 / Profile 2).
The position of the measure area and the profile can be determined by the option
Location [%]. The size ratio can be defined by the option Min. Size.
Measure area assigned to a temperature
profile (measure point)
Measure area assigned to a temperature
profile (rectangle)