
User guide


8 Chromatograms
IC Net 2.3
338
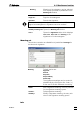
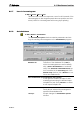
Make sure in «IC Net» that the item corresponding to the first
column always contains information, otherwise a line with no en-
try in the first column may be overwritten.
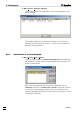
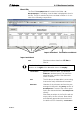
Charts
Chart name 1-n (concentration fluoride,….concentration sul-
phate
on the default files)
The number of charts, the name of the
charts and which data are displayed in the
charts are specified in the
[Header] section
of
ExcelReport.ini, the charts are built from
the data of the data worksheet.
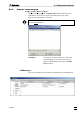
Chart name and title of the chart is the
header of the column specified as y-axis of
the chart.
Every chart has to have a unique chart
name, therefore no charts with the same
y-axis are possible.
Scaling of the y-axis is done automatically
depending on the values of the data points.
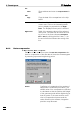
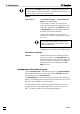
Calculation worksheet
statistics Example worksheet for statistical calcula-
tions on the data of the data worksheet. Ad-
ditional worksheets can be freely defined in
Excel for further processing of the data ex-
ported from the chromatograms of «IC
Net» to Excel.
Configuration file for Excel report
The file
ExcelReport.ini is located in the folder ..\IC Net\ExcelReport\.
This file defines which data are extracted by «IC Net» and how
they are written in the
ExcelReport.xls.
The ExcelReport.ini is a text file that can be edited with every text
editor. Lines starting with a semicolon are comments, they do not
affect the functionality of the Excel report.
The first part of the file contains a short description of the func-
tionality and the second part specifies how the Excel report is
built. This part consists of the following paragraphs: