
Instruction Manual
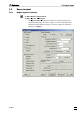

7.6 Report output
IC Net 2.2
175
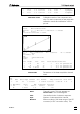
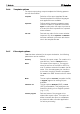
Chromatogram plot Plot of the chromatogram (only for Printer or
File destination).
Peak table Peak table with results. The structure of the
peak table depends on the selected Quanti-
fication method
. The following report is put
out as default:
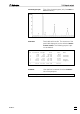
Quantitation method: Custom
No Retention Height Area Conc. Name
min mV mV*sec mg/L
1 3.04 1.85 21.062 0.079 fluoride
2 5.91 82.44 1703.350 7.173 chloride
3 6.83 3.58 97.495 0.000
4 14.29 29.27 969.705 7.561 nitrate
5 21.21 19.34 935.179 5.571 sulphate
_____________________________________________
5 25.01 136.48 3726.790 20.383
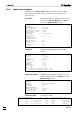
Comment User defined comment from the Comment
tab of the passport.
Method example for tap water determination.