
Instruction Manual

7.5 Calibration and quantification
IC Net 2.2
167
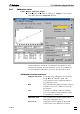
Worst case... Information on the component with the
worst (largest) deviation of actual and ex-
pected retention time. Deviation is given as
a part of component’s identification win-
dow.
Average relative deviation
Relative deviation averaged for all compo-
nents.
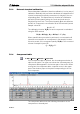
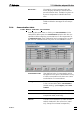
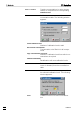
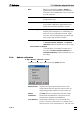
7.5.6 Concentration table
IC NET / Method / Calibration / Concentrations
Selecting this menu item or clicking on <Concentrations> in the
component table opens the Concentrations window with the con-
centration table containing concentrations of all components for
all Calibration levels. Each calibration level corresponds to a sam-
ple used for calibration and to a point on the calibration curve.
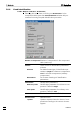
Concentration units User defined units of concentration which
will appear in the report. Nevertheless, entry
of new concentration units does not cause
recalculation of concentrations.
Data type
Choice of the data type that will be shown
in the concentration table: concentrations
(default setting), peak heights, peak areas,
volumes.
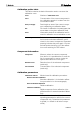
Number Number of the component (read-only).
Name Name of the component taken from the
component table (read-only).
This run Contains concentrations (or other chosen
values) obtained in the current run (read-
only, except for universal component).