
Instruction Manual


4.3 Exploratory curves
797 VA Computrace – Software
81
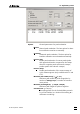
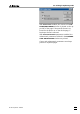
Table of results
Display of peak evaluation results.
No. Number of evaluation result. This number is also
displayed in the EXPLORATORY CURVES window.
Clicking this number with the right mouse button
offers the following menu:
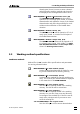
Edit baseline
Open the EDIT BASELINE window for further mo-
difying the peak evaluation for the selected peak
(see Edit baseline, section 4.3).
Copy
Copy the selected results line of the table to the
clipboard.
Copy Peak List
Copy all result lines of the table to the clipboard.
Copy Graphed Results
Copy the current content of the EXPLORATORY
CURVES
window to the clipboard.
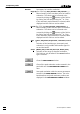
Position (V)
Calculated peak voltage at the peak maximum.
Height (A)
Calculated peak height from the baseline to the
peak maximum.
Area (W)
Calculated peak area between peak curve and cal-
culated baseline.
Derivative
Calculated difference between the positive and
negative maximum of the first derivative of the
voltammogram.