
Instruction Manual


8 How to ...?
797 VA Computrace – Software
256
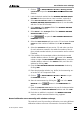
8. Enter the Sample ID (used as part of the determination file
name) in the
PLACE SAMPLE window and click <OK>.
9. At the end of the measurement, a curve is printed out. This
curve should satisfy the following conditions:
• A symmetrical, gaussian-shaped peak should be plot-
ted. The evaluation must provide a result for the peak
voltage and the peak current, which are printed out
in the full report.
• The peak voltage E should be -450 … -550 mV.
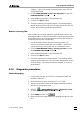
Perform a GLP Validation
The GLP validation is performed with the GLP Wizard (see section
2.7, GLP Wizard) . To start it, click on the GLP tab of
the GENERAL SETTINGS window.
.