
Instruction Manual


8.4 Methods in determination mode
797 VA Computrace – Software
209
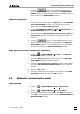
7. Click the button. The calculated baselines and
peak maximum positions are displayed in the EXPLORATORY
CURVES
window. The evaluation results are displayed in the ta-
ble of results in the PEAK SEARCH window.
Evaluate signal waves
1. Select the desired signal file in the Signal field of the EXPLORA-
TORY SPECIFICATION
window. The selected signal curve is
shown with the Selected signal properties.
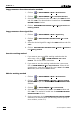
2. Click on EXPLORATORY CURVES / Signal / Wave evaluation. The
WAVE EVALUATION window is opened.
3. Set the parameters Minimum width, Minimum peak height and
Smooth factor for wave evaluation (see Wave evaluation, sec-
tion 4.3).
4. Click the button. The calculated tangents and po-
sitions of half-wave potentials are displayed in the
EXPLORA-
TORY CURVES
window. The evaluation results are displayed in
the table of results in the WAVE EVALUATION window.
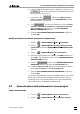
Print signal curves and/or voltammetric parameters
1. Click on or MAIN WINDOW / File / Print. The PRINT EX-
PLORATORY
window is opened.
2. Check the Print curves option if the content of the EXPLORA-
TORY CURVES
window should be printed.
3. Check the Print voltammetric parameters option if the parame-
ters in the EXPLORATORY SPECIFICATION window should be
printed.
4. Click the
<OK> button.
5. Select the parameters and properties for printing in the PRIN-
TER SETUP
window and click the <OK> button.
8.4 Methods in determination mode
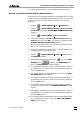
Load a method
1. Click on or MAIN WINDOW / Mode / Determination.
2. Click on or MAIN WINDOW / File / Load method.
3. Select the desired method file *.mth in the OPEN window and
click <OK>. The method is loaded into the WORKING METHOD
SPECIFICATIONS
window.