
Instruction Manual


5 Determination mode
797 VA Computrace – Software
148
EV
Sample
c
(s)
mean(s)
c
(eff)
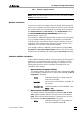
5. Calculation of result deviation Conc.dev.
The total deviation of the calculated substance concentration
Conc. is determined using a linear error calculation which takes
into account both the error contribution from the measure-
ment and that from the calibration. Independent of the number
of measurements, the total deviation Conc.dev. is always cal-
culated in a way that Conc. ± Conc.dev. gives the range in
which the mass concentration may be expected with a prob-
ability of 68.3%.
Rules for calibration curves
The result determination with the aid of a calibration curve sa-
ves time compared with standard additions, but is reliable only
• if the matrix of all samples and calibration solutions is identical
or has no influence on the measurement.
• if all measurement parameters (capillary, temperature, etc.) re-
main unchanged during measurements.
• if the accuracy of the results obtained is checked regularly with
the standard addition method.
With regard to optimum accuracy and scatter, a number of rules
must be observed with calibration curves:
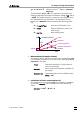
• Check linearity range
In development of the method, the linearity range of the cali-
bration curve should be checked for each substance by recor-
ding the curve over a wide concentration range. Using the cali-
bration curve shown in the DETERMINATION CURVES window,
you can then determine the region in which the curve is linear
and that in which it is nonlinear.
• Working in the linear range
Performing determinations in the linear range, to keep the scat-
ter as low as possible it is advisable to calibrate above all in the
lower and upper part of this range and select as many re-
plications as possible.
• Checking the offset
The size of the offset indicates a possible systematic error or
blank value. To convert this error into the effective mass con-
centration in g/L, Y.offset must be divided by Slope.