
Instruction Manual


5.8 Data processing and evaluation
797 VA Computrace – Software
147
y = a + b x+ c x
2
Nonlinear curve 2
nd
degree = Quadratic
Regression
The parameters a, b and d of the regression curves are calcu-
lated by weighted least square minimization with y = EV and x
= c(eff). The weight factor for each point is the standard devia-
tion obtained from the replications. The parameters are dis-
played in the RESULTS window and have the following mean-
ing:
a = Y.reg/offset Intercept of calibration curve
b = Slope Slope of calibration curve in the
linear region
d = Nonlin. Non-linearity factor
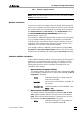
Calibration solutions
Y
.offset
EV
0
0
Slope
c
(
eff
)
Linear
Linear (trough Zero)
Nonlinear (trough Zero)
Nonlinear
Quadratic
3. Measurement of sample solution
The sample solution with the unknown mass concentration c(s)
of the sample is measured one or more times (defined by No. of
replications
). This gives:
EV(s) Evaluation quantity of a single measure-
ment for the sample
mean(s) Mean value of all evaluation quantities for
the sample
Std.dev.(s) Standard deviation of the individual value
EV(s)
= s(s)
4. Calculation of mass concentration c(s)
The sought mass concentration c(s) of the sample is calculated
by inserting mean(s) in the calibration function determined
earlier:
mean(s) = d c(s)
4
+ b c(s) – a