
Instruction Manual


5 Determination mode
797 VA Computrace – Software
126
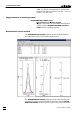
Auto scaling
DETERMINATION CURVES / Plot / Auto scale (F4)
Reset zooming and scale x and y axes so that all
measurement points of all determination curves
are visible.
Swap axis
DETERMINATION CURVES / Plot / Swap axis / abscissa
Swap x axis for the current determination curve.
DETERMINATION CURVES / Plot / Swap axis / ordinate
Swap y axis for the current determination curve.
Show baselines
DETERMINATION CURVES / Plot / Show baselines
If this option is enabled, the calculated baselines
are displayed in the determination curves subwin-
dow.
Show unknown peaks
DETERMINATION CURVES / Plot / Show Unknown peaks
If this option is enabled, all peaks found but not
assigned to a defined substance are marked in the
determination curves subwindow with "Unk".
Show spikes
DETERMINATION CURVES / Plot / Show Spikes
If this option is enabled, spikes are shown as red
points.
Graphical properties for determination curves
As default, the axes displayed in the determination curve subwin-
dow have the following orientation:
x axis The determination curves are displayed from the
left to the right (for anodic sweeps: from - to +;
for cathodic sweeps: from + to -). For cyclic
sweeps, the forward sweep is displayed from the
left to the right.
y axis The y axis is always displayed from the bottom to
the top with the same direction as the x axis (for
anodic sweeps: from - to +; for cathodic sweeps:
from + to -).
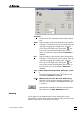
The following graphical properties for curves in the determination
curves subwindow can be set:
DETERMINATION CURVES / Plot / Properties / Curves window
The page properties of the determination curves