
Owner's manual

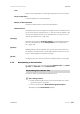
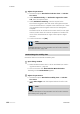
Table Of Contents
- Table of contents
- Table of figures
- 1 Introduction
- 2 Overview of the instrument
- 3 Installation
- 4 Operation
- 4.1 Fundamentals of operation
- 4.2 Instrument and Program Settings
- 4.3 Program information
- 4.4 Calibration functions
- 4.5 Methods
- 4.6 Determinations
- 4.6.1 Preparing samples
- 4.6.2 Preparing the instrument and the accessories
- 4.6.3 Preparing the determination
- 4.6.4 Starting the determination
- 4.6.5 Cleaning the instrument and accessories
- 4.6.6 Adjusting the method parameters during the determination
- 4.6.7 Stopping the determination manually
- 4.6.8 Status of the live curve
- 4.7 Results
- 4.8 GLP functions
- 5 Handling and maintenance
- 6 Troubleshooting
- 7 Technical specifications
- 8 Conformity and warranty
- 9 Accessories
- Index
4.7 Results
■■■■■■■■■■■■■■■■■■■■■■
120
■■■■■■■■
743 Rancimat
Parameter description
In the graphic temperature vs. time the linear regression is used to rep-
resent the calculated straight line T = ln(t)/B – ln(A)/B. The measured
values of the selected determination are shown in black, the regression
line in green and the time calculated for the target temperature in red.
Results
Formula
Exponential formula for calculating the time extrapolated from the meas-
ured values for the target temperature.
A
Calculated coefficient A of the exponential formula.
B
Calculated coefficient B of the exponential formula.
r
2
Calculated correlation coefficient. If this value is below the limit value (see
"Setting the correlation limit", page 119) specified by the administrator a
warning appears when opening the extrapolation window.