
User Manual


88. . Command ReferenceCommand Reference
726 Titroprocessor, Instructions for use
147147
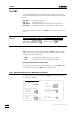
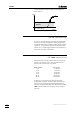
8.3.4 Curve display
The settings for the curve display are valid for both the live curve display
and the curve printout. The measurable variable display for the two axes and
their scale divisions can be set individually. Combined curves can also be
displayed (not live).
The possible settings of the curve display for MET titrations coincide with
those for the DET modes, except for the display of the derived curve, which
is not possible here (see below).
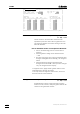
Quantity Y_Axis Measurable variable on the Y-axis
M. value | Volume | Temp. | dMW/dV
MW,Tem.p | MW,dMW/dV | all
Other display options are possible in addition to the
standard Measured Value/Volume display. The choice
of measuring quantities on the Y-axis is as follows:
M.value pH, mV or µA (in line with mode)
Volume i.e. volume against time
Temp. automatic measurement only
MW, Temp. Meas. value and temp. combined
all all displayable curves combined