
User's Guide Part 3

PureWave Quantum 6600 User Guide v2.1
Page 139
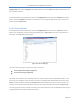
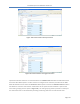
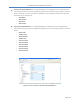
Downstream RSSI/CINR Metrics. The following Metrics are displayed. These are displayed as a
raw number but they can also be displayed in graphical form by selecting the "Graph" command
button. If the CLI is used to view metrics, the RSSI per antenna will be shown but will have the
same value across all antennas.
o CINR Mean
o CINR Std Dev
o RSSI Mean
o RSSI Std Dev
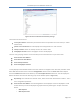
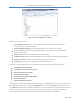
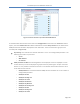
Upstream RSSI/CINR Metrics. . The following Metrics are displayed. These are displayed as a
raw number but they can also be displayed in graphical form by selecting the "Graph" command
button.
o Mean CINR
o Std Dev CINR
o Maximum RSSI
o Std Dev RSSI
o Antenna 1 RSSI
o Antenna 2 RSSI
o Antenna 3 RSSI
o Antenna 4 RSSI
o Antenna 5 RSSI
o Antenna 6 RSSI
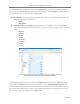
Figure 134: Sector Statistics Downlink RSSI CINR Metrics