
Quick Start Guide

Designed for Operators, by Operators
142 | P a g e
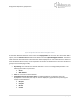
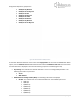
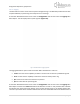
Figure 148 Sector Statistics Service Flow Throughput Counters
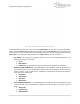
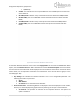
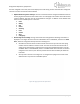
At the Main Web GUI Interface Screen select the Configuration Tab and then the sector Main Menu
Option, then the statistics-mss Main Menu Sub-Element and then rssi-cinrmetrics. The downstream and
upstream direction for each Subscriber will be displayed. There are two distinct groups to this window.
Figure 149 has the downstream RSSI parameters and Figure 150 has the upstream metrics.
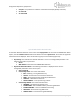
• Key Settings. This indicates the relevant Subscriber. This is not a configurable parameter. The
following information is presented:
o Sector.
o MAC Address.
o Channel Dir. This indicates the respective direction that the Metrics are displayed.
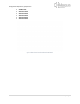
• Downstream RSSI/CINR Metrics. The following Metrics are displayed. These are displayed as a
raw number but they can also be displayed in graphical form by selecting the "Graph" command
button. If the CLI is used to view metrics, the RSSI per antenna will be shown but will have the
same value across all antennas.
o CINR Mean
o CINR Std Dev
o RSSI Mean
o RSSI Std Dev
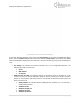
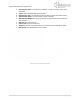
• Upstream RSSI/CINR Metrics. . The following Metrics are displayed. These are displayed as a raw
number but they can also be displayed in graphical form by selecting the "Graph" command
button.
o Mean CINR
o Std Dev CINR
o Maximum RSSI