
Quick Start Guide

Designed for Operators, by Operators
135 | P a g e
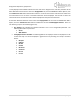
To fully display all the available statistics the User now has to navigate to the next level, therefore at the
Main Web GUI Interface Screen select the Configuration Tab and then the sector Main Menu Option then
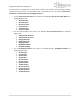
the statistics Main Menu Sub-Element, then service-flowmetrics and then 1. This will display the Metrics
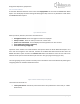
window. There are two distinct groups to this window (Figure 142).
• Key Settings. This indicates the relevant sector, which as has been described in number 1. This is
not a configurable parameter.
• Sector Service-Flow Metrics. The following Metrics are displayed. These are displayed as a raw
number but they can also be displayed in graphical form by selecting the "Graph" command
button.
o DSA Requests
o DSA Req Successes
o DSC Requests
o DSC Req Successes
o DSD Requests
o DSD Req Successes
o Max Active Svc Flows
o Max Active DL Svc Flows
o Max Active UL Svc Flows
Figure 142 Sector Statistics Interface Key Settings