
User Manual

3.5 LJscope
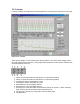
LJscope simulates an oscilloscope by reading data from 2 analog input channels in burst mode.
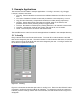
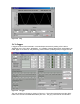
Figure 3-10. LJscope
There are two graphs on the LJscope main window (Figure 3-10), which show voltage versus
time and voltage versus frequency. Both graphs have a palette to control various features such
as autoscaling and zooming:
1. When you press this button it locks button 3 on (autoscale) position.
2. When you press this button it locks button 4 on (autoscale) position.
3. Pressing this button autoscales the x-axis.
4. Pressing this button autoscales the y-axis.
5. Miscellaneous x-axis formatting options.
6. Miscellaneous y-axis formatting options.
7. Zooming tool. Press this button to see different options for zooming. When collecting
data, zooming will not work well unless autoscaling is off.
8. Panning tool. Allows you to drag and scroll around the graph.
9. Not applicable.