
User guide


110 Chapter 8
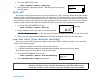
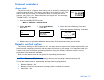
5 The AVG INSULIN (average insulin) screen is displayed. This screen shows:
➠ The average total insulin delivered per day
for the previous 12 days.
➠ The average total basal and bolus insulin
delivered and total percentage of basal and
bolus insulin delivered per day for the
previous 12 days.
➠ The average total carbs entered into the
pump per day (entered into the Bolus Wizard
feature) for the previous 12 days. To view
more data, press
.
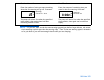
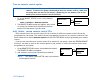
6 The AVG BOLUS screen is displayed. This screen
shows:
➠ The average total bolus insulin delivered per
day for the previous 12 days.
➠ The average total food bolus insulin
delivered per day for the previous 12 days
and the total average percentage of bolus
insulin delivered for the previous 12 days.
➠ The average total correction bolus insulin
delivered per day and the total average
percentage of bolus insulin delivered per day
for the previous 12 days.
➠ The average total manual bolus insulin delivered per day and the total average percentage of
bolus insulin delivered per day for the previous 12 days. To view more data, press
.
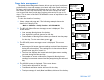
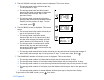
7 The NUM BOLUS (number of boluses) screen is displayed. This screen shows:
➠ The average total number of boluses delivered per day for the previous 12 days.
➠ The average total number of food only boluses delivered per day for the previous 12 days.
➠ The average total number of correction only boluses delivered per day for the previous 12 days.
➠ The average total number of food plus correction boluses delivered per day for the previous 12
days.
➠ The average total number of manual boluses delivered per day for the previous 12 days.
To get back to the HOME screen, press four times.
AVG INS 112.30U
Basal 60.20/ 54%
Bolus 52.10/ 46%
Carbs 253gr
AVG BOLUS52.10U
Food 36.50/70%
Corr 10.30/20%
Manual 5.30/10%
NUM BOLUS 4.2
Food/Corr 2.1/1
Food + Corr 1.1
Manual Bolus 1.0