
User guide


Utilities 109
Days to average
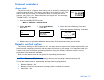
The DAYS TO AVERAGE screen allows you to
choose the number of days to average. This
example shows the previous 12 days as the number
of days to be averaged.
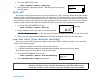
1 Select Daily Average and press ACT.
Main > Utilities > Daily Totals > Daily
Average
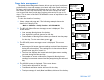
2 The DAYS TO AVERAGE screen is displayed.
Select the number of days you want to average
by pressing and
.
Press
ACT.
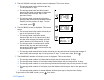
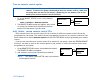
3 The AVG BG screen is displayed. This screen
shows:
➠ The average of all blood glucose values
entered into the pump for the previous 12
days.
➠ The average high and low blood glucose
values for the previous 12 days.
➠ The average number of blood glucose values
entered into the pump per day for the
previous 12 days. To view more data,
press
.
4 The SEN AVG (sensor average) screen is displayed. This screen shows:
➠ An average of all sensor glucose readings received from the sensor during the previous 12 days.
The readings are in the selected blood glucose units (mg/dL or mmol/L).
➠ The first line displays the lowest and the highest sensor reading received during the previous 12
days.
➠ The number of sensor calibrations (fingerstick blood glucose readings from a meter entered into
the pump) during the previous 12 days.
The flashing
number will be the
number of days
you have available
to average (up to
31 days).
DAILY TOTALS
DAYS TO AVERAGE
12
ACT
SEN AVG 130
Sen Low/Hi 80/201
Sen Cal/Data 6/288
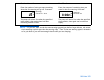
Daily Average
Today 26.5U
27Feb 48.5U
26Feb 54.5U
ACT
NOTE - Any
day marked
with an (*)
asterisk is
excluded from
the average.
AVG BG 128 mg/dL
BG Low/Hi 113/178
Number BGs 6.1
(continued on next page)