
User guide


Utilities 107
Pump data management
The pump data management feature allows you and your healthcare
professional to view and manage your basal and bolus insulin delivery,
BG data, and food intake with averages up to 31 days. You can view
the details of each day individually. You can also average the data
over a specified time period that you have selected up to (up to 31
days). This is done in the DAYS TO AVERAGE screen as explained in the
next section.
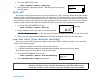
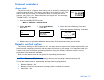
To view the details of one day:
1 Select a date and press ACT. The following example shows the
details for February 27th.
Main > Utilities > Daily Totals > 27 FEB 48.5U
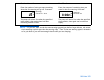
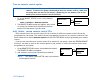
2 The BG AVG (Blood Glucose Average) screen is displayed. This
screen shows:
➠ Your average blood glucose for the day.
➠ Your high and low blood glucose for the day.
➠ Total number of blood glucose values you entered into the pump
for the day. To view more data, press .
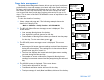
3 The SEN AVG (sensor average) screen is displayed. This screen
shows:
➠ An average of all sensor glucose readings received from the sensor
during the selected day. The readings are in the selected blood
glucose units (mg/dL or mmol/L).
➠ The first line displays the lowest and the highest sensor reading
received during the selected day.
➠ The number of sensor calibrations (fingerstick blood glucose
readings from a meter entered into the pump) during the selected
day.
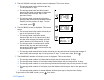
4 The INSULIN screen is displayed. This screen shows:
➠ Total insulin delivered for the day.
➠ Total Basal and Bolus insulin delivered for the day.
➠ Total percentage of each (Basal and Bolus) delivered for the day.
DAILY TOTALS
Daily Average
Today 26.5U
ACT
27FEB BG AVG 135
Today 48.5U
BG Low/Hi 92/176
Number BGs 6
27FEB BOLUS 28.50U
Food 14.50/51%
Corr 12.00/42%
Manual 2.00/7%
27FEB NUM BOLUS 8
Food/Corr 2/ 1
Food + Corr 1
Manual Bolus 4
27FEB INSULIN 48.5U
Basal 20.00/41%
Bolus 28.50/59%
Carbs 253gr
27FEB SEN AVG 135
Sen Low/Hi 92/178
Sen Cal/Data 6/288