
User`s guide


17
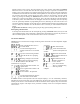
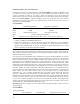
The evaluation screen
List of data
The left vertical frame of the evaluation screen displays a numeric list of blood pressure readings of
the open examination (ABPM recording). You can add or remove columns, or change their order
using Tools – Options. Use the mouse to drag the vertical frame separator to the right to show more of
this frame. Drag the vertical frame separator to the left to hide some of this frame. When the frame is
active, you can use the variable part of the toolbar to filter the list. Hypertensive values are displayed
in red; hypotensive values in green. Normal values are blue.
Graphic profile
The top horizontal frame of the evaluation screen displays a typical ABPM chart view of the open
examination. Depending on your frame settings (Tools – Options or F9 to access), the graphic blood
pressure profile may look slightly different. Systolic and diastolic blood pressure are by default
displayed as vertical red bars. Pulse rate values are by default displayed as a blue line. Background
shading helps to see day, night and optionally morning periods.
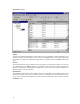
Statistics
The middle horizontal frame displays blood pressure statistics.
Histograms
The bottom horizontal frame – not shown above - displays blood pressure histograms.