
User's Manual

37
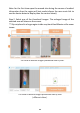
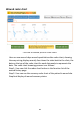
Wound radar chart
The view of wound process radar chart.
User can see several days wound quantitative data radar chart, showing
the way mining display recently four times the state back to the clinic; the
date on the top of the radar chart for each data analysis represents the
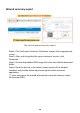
date. The radar chart browsing process is as follows:
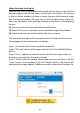
Step 1: User can click the radar chart button in the function list of the
wound history page.
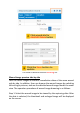
Step 2: User can see the recovery radar chart of the patient's wound site.
Graphical display of wound recovery status.