
User Manual


USB-1208LS User's Guide Functional Details
16
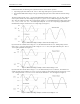
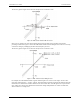
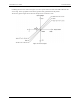
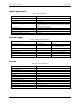
Combining these two error sources in Figure 12, we have a plot of the error band of the USB-1208LS for the
±10 V range. This is a graphical version of the typical accuracy specification of the product.
The accuracy plots in Figure 12 are drawn for clarity and are not drawn to scale.
Figure 12. Error band plot