
Specifications
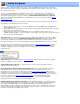


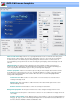

and contains both 2.0 and 5.1,) Axis color and scaling options. The default waveform display is linear, that is
a sound that is recorded at twice the level of another will be twice as high on the graph display. The Log
scale option changes the scale to a logarithmic scale, which corresponds to how people perceive the
relative difference in volumes. In general, a linear scale (Log scale not selected) will make it easier to view
where quiet passages are in the audio waveform.
Note: The thumbnail window automatically scales the visible waveform depending upon the data that is
being displayed. It is not an absolute scale.
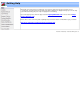
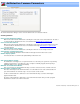
Show "No Graph" Warning: When Visualize Audio is selected, space is reserved in the thumbnail window
for audio graph. However, the graph is actually drawn only if the following two conditions are met:
1. The file being edited contains an audio stream.
2. The interval between thumbnails is 2 seconds or less.
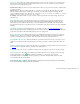
If Visualize Audio is selected and VideoReDo is unable to display a graph the following warning is displayed
if this option is selected:
VideoReDo TVSuite Help - © 2003-2007 DRDSystems, Inc.