
User`s guide


PCIM-DAS1602/16 User's Guide Specifications
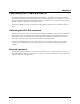
Accuracy
Typical Accuracy ±2.3 LSB
Absolute Accuracy ±5.0 LSB
Accuracy Components
Gain Error Trimmable by potentiometer to 0
Offset Error Trimmable by potentiometer to 0
PGA Linearity Error ±1.3 LSB typ , ±10.0 LSB max
Integral Linearity Error ±0.5 LSB typ , ±3.0 LSB max
Differential Linearity Error ±0.5 LSB typ, ±2.0 LSB max
Each PCIM-DAS1602/16 is tested at the factory to assure the board’s overall error does not exceed ±5 LSB.
Total board error is a combination of gain, offset, differential linearity and integral linearity error. The
theoretical absolute accuracy of the board may be calculated by summing these component errors. Worst case
error is realized only in the unlikely event that each of the component errors are at their maximum level, and
causing error in the same direction.
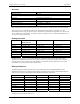
Analog input drift
Range Analog Input Full-
Scale Gain drift
Analog Input Zero drift Overall Analog Input drift
±10.00V 2.2 LSB/°C max 1.8 LSB/°C max 4.0 LSB/°C max
±5.000V 2.2 LSB/°C max 1.9 LSB/°C max 4.1 LSB/°C max
±2.500V 2.2 LSB/°C max 2.0 LSB/°C max 4.2 LSB/°C max
±1.250V 2.2 LSB/°C max 2.3 LSB/°C max 4.5 LSB/°C max
0 - 10.00V 4.1 LSB/°C max 1.9 LSB/°C max 6.0 LSB/°C max
0 - 5.000V 4.1 LSB/°C max 2.1 LSB/°C max 6.2 LSB/°C max
0 - 2.500V 4.1 LSB/°C max 2.4 LSB/°C max 6.5 LSB/°C max
0 - 1.250V 4.1 LSB/°C max 3.0 LSB/°C max 7.1 LSB/°C max
Absolute error change per °C Temperature change is a combination of the gain and offset drift of many
components. The theoretical worst case error of the board may be calculated by summing these component
errors. Worst case error is realized only in the unlikely event that each of the component errors are at their
maximum level, and causing error in the same direction.
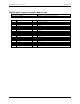
Noise performance
The following table summarizes the worst case noise performance for the PCIM-DAS1602/16. Noise
distribution is determined by gathering 50000 samples with inputs tied to ground at the PCIM-DAS1602/16
main connector. Data is for both Single-Ended and Differential modes of operation.
Range ±2 counts ±1 count Max Counts LSBrms*
±10.00V 97% 80% 11 1.7
±5.000V 97% 80% 11 1.7
±2.500V 96% 79% 11 1.7
±1.250V 96% 79% 11 1.7
0 - 10.00V 88% 65% 15 2.3
0 - 5.000V 88% 65% 15 2.3
0 - 2.500V 83% 61% 15 2.3
0 - 1.250V 83% 61% 16 2.4
* Input noise is assumed to be Gaussian. An RMS noise value from a Gaussian distribution is calculated by
dividing the peak-to-peak bin spread by 6.6
5-2