
Datasheet

MAX195
16-Bit, 85ksps ADC with 10µA Shutdown
24 ______________________________________________________________________________________
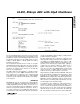
Total Harmonic Distortion
If a pure sine wave is input to an ADC, AC integral non-
linearity (INL) of an ADC’s transfer function results in
harmonics of the input frequency being present in the
sampled output data.
Total Harmonic Distortion (THD) is the ratio of the RMS
sum of all the harmonics (in the frequency band above
DC and below one-half the sample rate, but not includ-
ing the DC component) to the RMS amplitude of the
fundamental frequency.
This is expressed as follows:
where V
1
is the fundamental RMS amplitude, and V
2
through V
N
are the amplitudes of the 2nd through Nth
harmonics. The THD specification in the
Electrical
Characteristics
includes the 2nd through 5th harmon-
ics. In the MAX195, this distortion is caused primarily
by the changes in on-resistance of the AIN sampling
switches with changing input voltage. These resis-
tance changes, together with the DAC’s capacitance
(which can also vary with input voltage), cause a
varying time delay for AC signals, which causes sig-
nificant distortion at moderately high frequencies
(Figure 28).
Spurious-Free Dynamic Range
Spurious-free dynamic range is the ratio of the funda-
mental RMS amplitude to the amplitude of the next
largest spectral component (in the frequency band
above DC and below one-half the sample rate).
Usually, this peak occurs at some harmonic of the input
frequency. However, if the ADC is exceptionally linear,
it may occur only at a random peak in the ADC’s noise
floor.
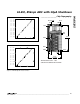
Transfer Function
Figures 29 and 30 show the MAX195’s transfer func-
tions. In unipolar mode, the output data is in binary for-
mat and in bipolar mode it is offset binary.
THD = 20log
V2 + V3 + V4 + ...+ V
V1
2 2 2
N
2
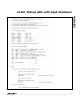
18
0
8021
14
MAX195 FG27
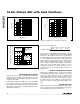
OUTPUT CODE (HEXADECIMAL)
OCCURRENCES OF OUTPUT CODE (THOUSANDS)
8024
6
2
4
8
12
16
8022 8023 8026
10
8025
8027
NO AVERAGING
IDEAL
CONVERSION
RUNNING
AVERAGE OF
5 SAMPLES
V
REF
= +4.5V
V
AIN
= +2.25V
UNIPOLAR MODE
85ksps
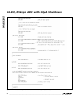
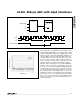
10
12
11
13
14
15
16
0.1 1 10 100
MAX195-26
FREQUENCY (kHz)
EFFECTIVE BITS
f
S
= 85kHz
T
A
= +25°C
Figure 27. Histogram of 16,384 Conversions Shows Effects of
Noise and Averaging
Figure 26. Effective Bits vs. Input Frequency
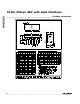
100
60
65
0.1 10 100
70
75
80
85
90
95
MAX195-28
FREQUENCY (kHz)
SINAD (dB)
1
f
S
= 85kHz
T
A
= +25°C
Figure 28. Signal-to-Noise + Distortion vs. Frequency