
Instruction Manual


MAX11300PMB1 Peripheral Module and Munich (USB2PMB1) Adapter Board Quick Start Guide
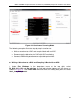
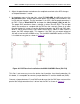
Figure 23. P0_DAC_0V>+10V Plot Window
The plot window now shows a sine wave, and the entire plot has 1024 data points.
While Continuous Scan is in progress, this waveform is written to the DAC and the
speed depends on how many DAC and ADC pins are available and how many plot
windows are open.
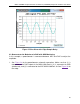
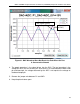
2. In the drop-down menu at the top right, select P10_ADC_0>+10V and click the Get
plot box button. A plot window opens and shows the analog level on the ADC as shown
in Figure 24.
Figure 24. P10_ADC_0>+10V Plot Window
23