
User`s guide
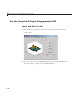
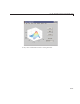

CodetheSimpleProgrammaticGUI
function simple _gui 2
% SIMPLE_GUI 2 Select a data set from the pop-u p menu, then
% click one of the plot-typ e push buttons. Cli cking the button
% plots the selected data i n the axes.
% Create and hide the GUI figure as it is being construct ed.
f = figure('Visible','off','Pos ition',[360,500,450,285] );
% Construct the components
hsurf = uicontrol('Style','push button','String','Surf', ...
'Position',[315,220,70,25]);
hmesh = uicontrol('Style','push button','String','Mesh', ...
'Position',[315,180,70,25]);
hcontour = uicontrol('Style','p ushbutton',...
'String','Countour',...
'Position',[315,135,70,25]);
htext = uicontrol('Style','text ','String','Select Data',...
'Position',[325,90,60,15]);
hpopup = uicontrol('Style','pop upmenu',...
'String',{'Peaks','Membrane','Sinc'},. ..
'Position',[300,50,100,25]);
ha = axes('Units','Pixels','Pos ition',[50,60,200,185]);
align([hsurf,hmesh,hcontour,htext,hp opup],'Center','None');
% Create the data to plot
peaks_data = peaks(35);
membrane_data = membrane;
[x,y] = meshgrid(-8:.5:8);
r = sqrt(x.^2+y.^2) + eps;
sinc_data = sin(r)./r;
% Initialize the GUI.
% Change units to normalize d so components res ize
% automatica lly.
set([f,hsurf,hmesh,hcontour,htext,hp opup],...
'Units','normalized');
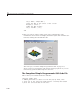
%Create a plot in the axes.
current_data = peaks_data;
surf(current_data);
% Assign the GUI a name to appear in the window title.
3-15