
User`s guide
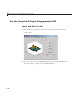


3 How to Create a Simple GUI Programmatically
resize when the GUI is resized. Normalized units map the lower-left corner
ofthefigurewindowto
(0,0) and the upper-right corner to (1.0, 1.0).
• Generate the data to plot. The example needs three sets of data:
peaks_data, membrane_data,andsinc_dat a. Each set corresponds to
one of the items in the pop-up menu.
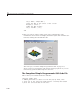
• Create an initial plot in the axes
• Assign the GUI a name that appears in the window title
• Move the GUI to the center of the screen
• Make the GUI visible
1 Replace this code in editor:
% Make the GUI visible.
set(f,'Visible','on')
with this code:
% Initialize the GUI.
% Change units to normalize d so components res ize automatically.
set([f,hsurf,hmesh,hcontour,htext,h popup],'Units','normaliz ed');
% Generate the data to plot.
peaks_data = peaks(35);
membrane_data = membrane;
[x,y] = meshgrid(-8:.5:8);
r = sqrt(x.^2+y.^2) + eps;
sinc_data = sin(r)./r;
% Create a plot in the axes.
current_data = peaks_data;
surf(current_data);
% Assign the GUI a name to appear in the window title.
set(f,'Name','Simple GUI')
% Move the GUI to the center of the sc ree n.
movegui(f,'center')
% Make the GUI visible.
set(f,'Visible','on');
2 Verify that your code file now looks like this:
3-14