
User`s guide
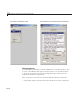

GUI that Displays and Graphs Tabular Data
• htab le — To fetch table data and column names for plotting the data
and deleting lines; the
column argument identifies which colum n to d raw
or erase.
•
haxes — To draw lines and delete lines from the axes.
•
hprompt — To remove the prompt (which only displays until the first line is
plotted) from the axes.
Keying on the
column argument, the callback takes the following actions.
• It extracts data from the table and calls
plot, specifying data from the
given column as
YData, and setting its DisplayName property to the
column’s name.
• It deletes the appropriate line from the plot when a check box is deselected,
based on the line’s
DisplayName property.
The
plot_callback code is as follow s. To view this code in the Editor, click
here.
function plot_c allb ack(hObject, eventd ata, column)
% hObject Hand le to Plot menu
% eventdata Not used
% column Number of column to plot or clear
colors = {'b','m','r'}; % Use consistent color for lines
colnames = get(htable, 'ColumnName');
colname = colnames{column};
if get(hObject, 'Value')
% Turn off the advisory text; it never comes back
set(hprompt, ' Visi ble', 'off')
% Obtain the data for that column
ydata = get(htable, 'Data');
set(haxes, 'Ne xtPl ot', 'Add')
% Draw the line plot for column
plot(haxes, yd ata( :,column),...
'DisplayName', colname,...
'Color', colo rs{c olumn});
else % Adding a line to the plot
% Find the lineseries object and delete it
delete(findobj(haxes, 'DisplayName', colname))
15-29