
User`s guide

15 Examples of GUIs Created Programmatically
32
33
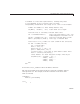
If rows 5, 6, and 7 of columns 2 and 3 are selected,
eventdata =
Indices: [6x2 double]
sel =
52
53
62
63
72
73
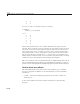
After hiding all the markers, the callback identifies the unique columns
selected. Then, iterating over these columns, the row indices for the selection
are found; x-values f or all row indices that don’t appear in the selection are
set to empty. The vector of x-valuesisusedtocopyy-values from the table
and specify dummy z-values. (Setting the z-values ensures that the m arkers
plot on top of the lines.) Finally, the x-, y-, and z-values are assigned to the
XData, YData,andZData of each vector of markers, and the markers are made
visible once again. Only markers with nonempty data display.
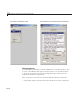
The user can add or rem ove individual markers by Ctrl+clicking table cells. If
the cell is highlighted in this manner, its highlighting disappears, as does its
marker. If it is not highlighted, highlighting appears and its marker displays.
The Plot Check Box c allback
The three Plot check boxes all share the same callback, plot_callback.
It has one argument in addition to the standard
hObject and eventdata
parameters:
•
column — An integer identifying which box (and column of data) the
callback is for
It also uses handles found in the function workspace for the following
purposes:
15-28