
User`s guide

GUI that Displays and Graphs Tabular Data
% Callback to erase and replot markers, showing only those
% corresponding to user-selected cells in table.
% Repeatedly called while user drags across c ells of the uitable
% hmkrs are handles to lines having markers only
set(hmkrs, 'Vi sibl e', 'off') % turn them off to begin
% Get the list of currently selected table c ells
sel = eventdata.Indices; % Get selection indice s (row, col)
% Noncontiguous selections are ok
selcols = unique(sel(:,2)); % Get all selected data col IDs
table = get(hObject,'Data'); % Get copy of u itab le data
% Get vectors of x,y values for each column in the selectio n;
for idx = 1:numel(selcols)
col = selcols(idx);
xvals = sel(:,1);
xvals(sel(:,2) ~= col) = [];
yvals = table(xvals, col)';
% Create Z-vals = 1 in o rder to plot marker s above lines
zvals = col*ones(size(xvals));
% Plot markers for xvals and yvals using a line object
set(hmkrs(col), 'Visible', 'on',...
'XData', xvals ,.. .
'YData', yvals ,.. .
'ZData', zvals )
end
end
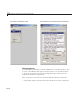
To view the se lect _callback code in the Editor, click h ere.
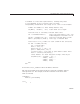
The rows and columns of the selected cells are passed in
eventdata.Indices
and copied into sel. For example, if all three columns in row three of the
table are selected,
eventdata =
Indices: [3x2 double]
sel =
31
15-27