
User`s guide

15 Examples of GUIs Created Programmatically
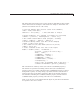
% Create an axes on the right side; set x and y limits to the
% table value extremes, and format labels for the demo data.
haxes = axes('Units', 'normalized',...
'Position', [.465 .065 .50 .85],...
'XLim', [0 tablesize(1)],...
'YLim', [0 max(max(count))],...
'XLimMode', 'manual',...
'YLimMode', 'manual',...
'XTickLabel',...
{'12 AM','5 AM','10 AM','3 PM','8 PM'});
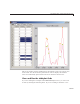
title(haxes, 'Hourly Traffic Co unts') % Describe data set
% Prevent axes from clearin g when new lines or markers are p lotted
hold(haxes, 'all')
Next, create the lineseries for the markers with a call to plot, which graphs
the entire
count data set (which remains in the workspace after being copied
into the table). H ow ever, the markers are immediately hidden, to be revealed
when the user selects cells in the data table.
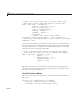
% Create an invisible marker p lot of the data and save handles
% to the lineseries objects; use this to s imul ate data brushing.
hmkrs = plot(count, 'LineStyle', 'none',...
'Marker', 'o',. ..
'MarkerFaceColor', 'y',...
'HandleVisibility', 'off',...
'Visible', 'off ');
The main function goes on to define three check boxes to control plotting of
thethreecolumnsofdataandtwostatictextstrings.Youcanseethecodefor
this when you display
tableplot.m.
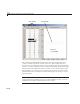
The Cell Selection Callback
ThecodefortheCellSelectionCallback, which shows and hides markers on
the axes, is
function select _cal lback(hObject, even tdat a)
% hObject Handle to uitable1 (see GCBO )
% eventdata Curre ntly selected table indices
15-26