
User`s guide

GUI that Displays and Graphs Tabular Data
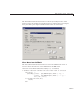
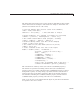
The main tableplot function sets up the uitable is immediately after loading
adatamatrixintotheworkspace. Thetable’ssizeadaptstothematrixsize
(matrices for uitables must be 1-D or 2-D).
% Load some tabular data (traf fic counts from som ewhere)
count = load('count.dat');
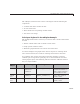
tablesize = size(count); % This demo data is 24-by-3
% Define parameters for a uitable (col hea ders are fictional)
colnames = {'Oak Ave', 'Was hington St', 'Cente r St'};
% All column contain numeric data (integers, a ctually)
colfmt = {'numeric', 'numeric', 'numeric'};
% Disallow editing values ( but this can be changed)
coledit = [false false fals e];
% Set columns all the same width (must be in pixels)
colwdt = {60 60 60};
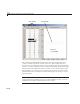
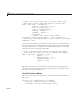
% Create a uitable on the left side of the figure
htable = uitable('Units', 'normalized',...
'Position', [0. 025 0.03 0.375 0.92 ],.. .
'Data', count,...
'ColumnName', c olna mes,...
'ColumnFormat', colfmt,...
'ColumnWidth', colwdt,...
'ColumnEditable', coledit,...
'ToolTipString',...
'Select cells to highlight the m on the plot',...
'CellSelectionCallback',{@select_callb ack});
The columns have arbitrary names (set with the ColumnName property).
All columns are specified as holding numeric data (the
ColumnFormat
property) and set to a width of 60 pixels (the Colu mnWi dth property is always
interpreted as pixels). A tooltip string is provided, and the
count matrix is
passed to the table as the
Data parameter. Most of the uitable properties
are defaulted, including the
CellEditCallback property and the related
ColumnEditable property (causing table cells to be noneditable).
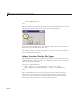
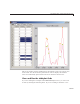
Next, set up an axes on the right half of the figure. It plots lines and markers
in res ponse to the user’s actions.
15-25