
User`s guide
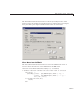
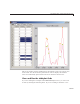
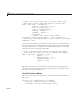

GUI that Displays and Graphs Tabular Data
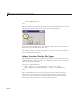
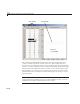
The circle markers appear and disappear dynamically as the user selects cells
in the table. You do not need to plot lines in order to display the markers.
Lines are individually plotted a nd removed via the three check boxes.
View and Run the tableplot Code
If you are reading this example in the MATL AB Help browser, you can access
its files by clicking the following links. If you are reading on the Web or in a
15-23