
User`s guide

GUI that Displays and Graphs Tabular Data
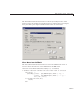
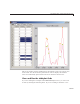
The tableplot main function creates a GUI figure with the following UI
components:
• A uitable w ith three columns of data
• An axes with a title
• Three check boxes for plotting columns of data
• Two static text strings
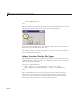
Techniques Explored in the tableplot Example
The example demonstrates some ways to interact with a uitable and the data
it holds:
• Extract column names a nd use them as menu items
• Graph specific columns of data
• Brush the graph when the user selects cells in the table
A 2-D axes displays line graphs of the data in response to selecting check
boxes and in real time, the results of selecting observations in the table.
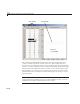
To coordinate plot creation and removal and data brushing, uicontrol
callbacks pass in arguments specifying one or more handles of each other
and of graphic objects. The following table describes the callbacks and how
they use object handles.
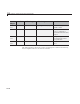
UI
Object
Handle Callback Type Callback Signature Remarks
uitable
htable Cell
Selection
Callback
{@select_callback}
Sets x,y,z values for
nonselected markers to
empty; makes m arkers
for
eventdata visible.
Check
box
—
Callback {@plot_callback,1}
Plots a line graph of
column 1 data.
Check
box
—
Callback {@plot_callback,2}
Plots a line graph of
column 1 data.
15-21