
User`s guide

15 Examples of GUIs Created Programmatically
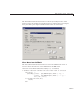
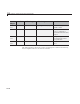
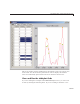
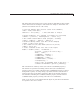
Plot columns
uitable with
named columns
Axes with
x- and y-labels
Initial prompt
The table displays MATLAB sample data ( coun t.dat) containing hourly
counts of vehicles passing by at three locations. The example d oes not
provide a way to change the data except by modifying the
tableplot.mmain
function to read in a different data set and then manually assign appropriate
column names and a different title for the plot. A more natural w ay to add
this capability is to allow the user to supply input arguments to the GUI to
identify a data file or workspace variable, and supply text strings to use for
column headers.
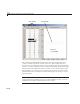
Note You can also create GUIs with GUIDE that contain uitables. See
“GUI to Interactively Explore Data in a Table (GUIDE)” on page 1 0-31 for a
GUIDE-based example of plotting data from a uitable
15-20