
User`s guide

GUI that Displays and Graphs Tabular Data
GUI that Displays and Graphs Tabular Data
In this section...
“About the tableplot Example” on page 15-19
“View and Run the tableplot Code” on page 15-23
“Set Up and Interact with the uitable” on page 15-24
“Subfunction Summary for tableplot” on page 15-30
“Furth er Explor ations with tableplot” on pag e 15-30
About the tableplot Example
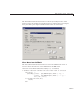
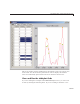
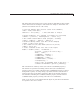
The tableplot example GUI presents data in a three-column table (a uitable
object) and enables the user to plot any column of data as a line graph. When
the user selects data values in the table, the plot displays markers for the
selected observations. This technique is called data brushing, and is available
in M ATLAB. (See “Marking Up Graphs with Data Brushing”.) The data
brushing performed by this GUI does not rely on MATLAB data brushing,
because that feature does not apply to uitables. The GUI, with its main
components called out, looks like this w hen you first open it.
15-19