
User`s guide
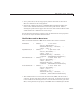
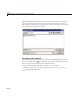

GUI with Axes, Menu, and Toolbar
• The uipusht ool function creates the two push buttons on the toolbar.
• The uipushtool
TooltipString property assigns a tool tip that d isplays
when the GUI user moves the mouse pointer over the button and leaves
it there.
• The
CData property specifies a truecolor image that displays on the button.
For these two buttons, the utility
iconRead function supplies the image..
• For each of the uipushtools, the
ClickedCallback property specifies the
callback that executes when the GUI user clicks the button. Note that the
Open push button
and the Print push button use the same callbacks
as their counterpart menu items.
See “Create Toolbars for Programmatic GUIs” on page 11-88 for more
information.
Initialize the GUI
These statements create the plot that appears in the GUI when it first
displays, and, if the user provides an output argument when running the
GUI, define the output that is returned to the user .
% Update the plot with t he initial plot type
localUpdatePlot();
% Define default output and return it if it is requested by users
mOutputArgs{1} = hMainFigure;
if nargout>0
[varargout{1:nargout}] = mOutputArgs{:};
end
• The localUpd atePlot function plots the selected plot type in the axes. For
a pop-up menu, the uicontrol
Value property specifies the index of the
selected m enu item in the
String property. Since the default value is 1,
the initial selection is
'plot(rand(5))'.ThelocalUpdatePlot function
is a helper function that is defined later in the script, at the same level
as the callbacks.
• Thedefaultoutputisthehandleofthemainfigure.
15-13