
User`s guide
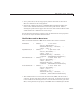
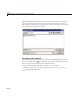

GUI with Axes, Menu, and Toolbar
3 edit ico nRea d.m or Click he re to open the utility iconRead file in the
Editor .
If you just want to run the GUI and inspect its code, follow these steps:
1 ClickheretoaddtheexamplefilestotheMATLABpath(onlyforthe
current session).
2 ClickheretoruntheaxesMenuToolbar GUI.
3 ClickheretodisplaytheaxesMenuToo lbar code in the Editor (read-only).
4 ClickheretodisplaytheutilityiconRead file in the Editor (read-only).
Note Do n o t save GUI files to the examples folder where you fo und them,
or you will overwrite the original files. Save them to your current or other
folder that you work in.
Generate the Graphing Commands and Data
The example defines two variables mOutputArgs and mPlotTypes.
mOutputArgs is a cell array that holds output values should the user request
them to be returned. The exam ple lat er assigns a default value to this
argument.
mOutputArgs = {}; % Variable for storing output when GUI returns
mPlotTypes is a 5-by-2 cell array that specifies graphing functions and data
for them, both as strings and as anonymous functions. The first column
contains the strings that are used to populate the pop-up menu. The second
column contains the functions, as anonymous function handles, that create
the plots.
mPlotTypes = {... % Example plot types shown by this GUI
'plot(rand(5))', @(a)plot(a,rand(5));
'plot(sin(1:0.01:25))', @(a)plot(a,sin(1:0.01:25));
'bar(1:.5:10)', @(a)bar(a,1:.5:10);
15-7