
User`s guide
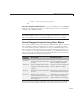
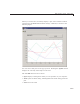

GUI with Axes, Menu, and Toolbar
When you run the GUI, it initially displays a plot of fiv e random numbers
generated by the MATLAB command
rand(5) command, as shown in the
following figure.
You ca
n select other plots in the po p-up me nu. Clicking the Update button
disp
lays the currently selected plot on the axes .
The G
UI File menu has three items:
• Ope
n displays a dialo g from which you can open files on y our computer.
• Pri
nt opens the Print dialog. Clicking Yes in the Print dialog prints the
plo
t.
• Cl
ose closes the GUI.
15-5