
User`s guide

Examples: Program GUI C omponents
Program Axes
Axes components enable your GUI to display graphics, such as graphs and
images. This topic briefly tells you how to plot to an axes in your GUI.
In most cases, you create a plot in an axes from a callback that belongs to
some other compo ne nt in the GUI. For example, pressing a button might
trigger the plotting of a graph to an axes. In this case, the button’s
Callback
callback contains the code that generates the plot.
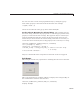
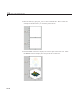
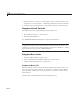
The follo wing example contains two axes and two push buttons. Clicking the
first button generates a
contour plot in one axes a nd clicking the other button
generates a
surf plot in the other axes. The example generates data for the
plots using the
peaks function, w hich returns a square matrix obtained by
translating and scaling Gaussian distributions.
1 Save this code in a f ile named two_axes.m.
function two_ax es
fh = figure;
bh1 = uicontrol(fh,'Position',[ 20 290 60 30],...
'String','Plot 1',...
'Callback',@button1_plot);
bh2 = uicontrol(fh,'Position',[ 20 100 60 30],...
'String','Plot 2',...
'Callback',@button2_plot);
ah1 = axes('Parent',fh,'units', 'pixels',...
'Position',[120 220 170 170]);
ah2 = axes('Parent',fh,'units', 'pixels',...
'Position',[120 30 170 170]);
%----------------------------------- -------------
function but ton1 _plot(hObject,eventdata )
contour(ah1,peaks(35));
end
%----------------------------------- -------------
function but ton2 _plot(hObject,eventdata )
surf(ah2,peaks(35));
end
end
12-31