
User`s guide

12 Code a Programmatic GUI
function pushbu tton _callback(hObject, eventdata, var1, va r2)
plot(var1,var2)
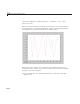
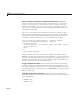
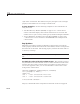
When you run this GUI by pressing the push button, you see a line graph of
myvar appearing as a magenta dashed line, similar to the following (graphs
candifferduetousingthe
rand function to generate data).
Because the value of myvar was copied into the callback when it was set,
clicking the button always produces the same plot, even if the value of
myvar
changes in the base workspace.
For m ore information, see “D efining Callbacks as a Cell Array of Strings
—SpecialCase”.
12-16