
User`s guide

2 How to Create a GUI with GUIDE
% uiwait(handles.f igure1);
2 Create data for the GUI to plot by adding the following code to the opening
function immediately after the comment that begins
% varargin...
% Create the data to plot.
handles.peaks=peaks(35);
handles.membrane=membrane;
[x,y] = meshgrid(-8:.5:8);
r = sqrt(x.^2+y.^2) + eps;
sinc = sin(r)./r;
handles.sinc = sinc;
% Set the current data valu e.
handles.current_data = handles. peaks;
surf(handles.current_data)
The first six executable lines create the data using the MATLAB functions
peaks, membrane,andsinc. They store the data in the handles structure,
an argument provided to all callbacks. Callbacks for the push buttons can
retrieve the d ata from the
handles structure.
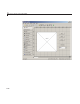
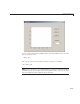
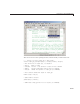
The last two lines create a current data value and set it to peaks, and then
display the surf plot for peaks. The following figure shows how the GUI
now looks when it first displays.
2-30