
User`s guide
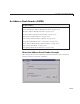

A GUI to Set Simulink
®
Model Parameters (GUIDE)
• Create an axes, set its Paren t property to the figure handle, and save the
axes handle.
• Create the plot (which is one or more line objects), save these line handles,
and set their
Parent properties to the handle of the axes.
• M ake the figur e v isible.
Plot Button Callback Listing
Here is the Plot button callback.
function PlotButton_Callb ack(hObject, eventdata, handles)
currentVal = get(handles.ResultsList,'Value');
% Get data to plot and generate command string with color
% specified
legendStr = cell(length(currentVal),1);
plotColor = {'b','g','r','c','m','y','k'};
for ctVal = 1:length(currentVal);
PlotData{(ctVal*3)-2} =
handles.ResultsData(currentVal(ctVal)).timeVector;
PlotData{(ctVal*3)-1} =
handles.ResultsData(currentVal(ctVal)).outputVector;
numColor = ctVal - 7*( fl oor((ctVal-1)/7) );
PlotData{ctVal*3} = plotColor{numColor};
legendStr{ctVal} = ...
[handles.ResultsData(currentVal(ctVal)).RunName,'; Kf=',...
num2str(handles.ResultsData(currentVal(ctVal)).KfValue),...
'; Ki=', ...
num2str(handles.ResultsData(currentVal(ctVal)).KiValue)];
end
% If necessary, create the plot figure and store in handles
% structure
if ~isfield(handle s,'PlotFigure') ||...
~ishandle(handles.PlotFigure),
handles.PlotFigure = ...
figure('Name','F14 Simulat ion Output',...
'Visible','off','NumberTitle','off',...
'HandleVisibility','off','IntegerHandle','off');
handles.PlotAxes = axes('Parent',handles.PlotFigure);
guidata(hObject, handles)
10-77