
User`s guide

10 Examples of GUIDE GUIs
if isequal(numResu lts,length(currentVal)),
resultsStr = {'<empty>'};
currentVal = 1;
set([handles.RemoveButton,handles.PlotButton],'Enable','off')
end
% Ensure that list box Value is valid, then reset Value and String
currentVal = min(currentVal,size(resultsStr,1));
set(handles.ResultsList,'Value',currentVal,'String',resultsStr)
% Store the new ResultsDat a
guidata(hObject, h andles)
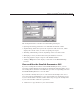
Plot Results Data
The GUI Plot button callback creates a plot of the run data and adds a
legend. The data to plot is passed to the callback in the
handles structure,
which also contains the gain settings used when the simulation ran. W hen a
user clicks the Plot button, the callback executes the following steps:
• Collects the data for each run selected in the Results list, including two
variables (time vector and output vector) and a color for each result run
to plot.
• Generates a string for the legend from the stored data.
• Creates the figure and axes f or plotting and saves the h andles for use by
the Close button callback.
• Plots the data, adds a legend, and makes the figure visible.
Plot Into the Hidden Figure
The figure that contains the plot is created as invisible and then made visible
after adding the plot and legend. To prevent this figure from becoming the
target for plotting commands issued at the command line or by other GUIs, its
HandleVisibility and In tegerHandle properties are set to off.Thismeans
thefigureisalsohiddenfromthe
plot and legen d com m ands.
Use the following steps to plot into a hidden figure:
• Save the h andle of the figure when you create it.
10-76