
User`s guide

10 Examples of GUIDE GUIs
% we want to do anything else to them
handles.axes1fig = axes1fig;
handles.axes1copy = axes1copy;
guidata(hObject,handles);
The other callback, plot _ax2_Callback,isidenticaltoplot_ax1_C all back,
except that all instances of
1 inthecodearereplacedby2,andpoplabel
is replaced with sellabel.Thep oplabel and sellabel objects are the
Population and Selection labels on
axes1 and axes2, respectively. These
strings a re appended to the current
Title for uipanel3 to create a title for
the plot in the new figure
axes1fig or axe s2fig.
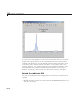
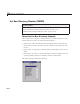
Use Plot in New Window Feature. Whenever the user right-clicks one of
the axes and selects
Open plot in new window, a new figure is generated
containing the graph in the axes. The callbacks do not check whether a graph
exists in the axes (
axes2 is empty until the user selects cells in the Data
Set) or whether a previously opened figure contains the same graph. A new
figure is always created and the contents of
axes1 or axes2 arecopiedintoit.
For example, here the user right-clicks a periodogram in
axes1 and chooses
Open plot in new window.
10-50