
User`s guide

GUI to Interactively Explore Data in a Table (GUIDE)
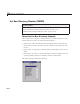
7 Click OK to save your menus and exit the Menu Editor.
For more information about using the Menu Editor, see “Create Menus in a
GUIDE GUI” on page 6-101.
Attach Contex t M e n us to Axes. Add the context menus you just created
to the axes:
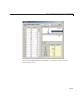
1 In the GUIDE Layout Editor, double-click axes1 (the top axes in the upper
right corner) to open it in the Property Inspector.
2 Click the right-hand column next to UIC onte xtMenu to see a drop-down list.
3 From the l ist, select plot_axes1.
Perform the same steps for
axes2,butselectplot_axes2 as its
UIContextMenu.
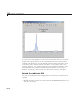
Code Context Menu Callbacks. The two context menu items perform the
same actions, but create different objects. Each has its own callback. Here is
the
plot_ax1_Callback callback for axes1:
function plot_a x1_C allback(hObject, ev entd ata, handles)
% hObject handle to plot_ax1 (see G CBO)
% eventdata re serv ed - to be defi ned in a future ver sion of MATLAB
% handles structure with handles and user data (see GUIDATA)
%
% Displays contents of axes 1 at larger size in a new figure
% Create a figure to receiv e this axes' data
axes1fig = figure;
% Copy the axes and size it to the figure
axes1copy = copyobj(handles.axes1,axes1fig);
set(axes1copy,'Units','Normalized', ...
'Position',[.05,.20,.90,.60])
% Assemble a title for this new figure
str = [get(handles.uipanel3,'Ti tle') ' for ' . ..
get(handles.poplabel,'String')];
title(str,'Fontweight','bold')
% Save handles to new fig and axes in case
10-49