
User`s guide

GUI to Interactively Explore Data in a Table (GUIDE)
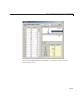
updates the Data Statistics table with the recomputed statistics. Here is the
code for
refreshDisplays:
function refres hDis plays(table, handle s, item)
if isequal(i tem, 1)
ax = handles.axes1;
elseif isequ al(i tem,2)
ax = handles.axes2;
end
peak = plotPeriod(ax, table,...
get(handles.plot_type,'Value'));
stats = get(handles.data_stats, 'Data');
stats = setStats(table, stats, item, peak);
set(handles.data_stats, 'Data', stats);
If you a re reading this document in the MA TLAB Help Browser, click the
names of the functions underlined above to see their complete code (including
comments) in the MATLAB Editor.
Display Graphs in New Figure Windows
• “Create T wo Context Menus” on page 10-48
• “Attach Context Menus to Axes” on page 10-49
• “Code Context M enu Callbacks” on page 10-49
• “Use P lot in New Window Feature” on page 10-50
The
tablestat GUI contains code to display e ither of its graphs in a larger
size in a new figure window when the user right-clicks either axes and selects
the pop-up menu item, Open plot in new window. The static text string
(tagged
newfig) above the plot panel, Right-click plots for larger view,
informs the user that this feature is available.
The axes respond by:
1 Creating a n ew figure window.
2 Copying their contents to a new axes parented to the new figure.
10-47