
User`s guide

GUI to Interactively Explore Data in a Table (GUIDE)
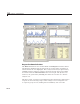
discontiguous rows to a selection. Because the Cell Sele ction Callback is
triggered as long as the user holds the left mouse button down w ithin the
table, the selection statistics and lower plot are refreshed until selection is
completed.
Selection data is generated during mouseDown events (mouse drags in the
data table). The uitable passes this stream of cell indices (but not cell values)
via the
eventdata structure to the data_table_CellSelectionCallback
callback. The callback’s code reads the indices from the Indic es member
of the
eventdata.
When the callback runs (for each new value of
eventdata), it turns the event
data into a set of rows:
selection = eventdata.Indices(:,1) ;
selection = unique(selection);
The event data contains a sequence of [ row, column] indices for each
table cell currently selected, one cell per line. The preceding code trims the
list of indices to a list of selected rows, removing column indices. Then it
calls the
unique MATLAB function to eliminate any duplicate row entries,
which arise whenever the user selects both columns. F or example, suppose
eventdata.Indices contains:
11
21
31
32
42
This indicates that the user selected the first three rows in colum n one (Year)
and rows three and four in column two (Sunspots) by holding down the Ctrl
key when selecting numbers in the second column. The preceding code
transforms the indices into this vector:
1
2
3
4
10-45