
User`s guide

10 Examples of GUIDE GUIs
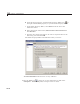
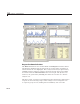
Respond to Data Selections
The Dat
aSettable has two columns: Year and Sunspots. The data tables’s
Cell S
election Callback analyzes data from its second column, regardless of
which
columns the user highlights. The
setStats function (not generated by
GUIDE
) com putes summary statistics observations from the second column
for in
sertion into the Data Statistics table on the right. The
plotPeriod
func
tion ( not generated by G UID E) plots either the raw data or a Fourier
anal
ysis o f it.
The
data_table_CellSelectionCallback function manages the application’s
res
ponse to users selecting ranges of data. Ranges can be contiguous rows
or s
eparate groups of rows; holding down the Ctrl key lets users add
10-44